
Most Fuel Efficient Highway Speed: Engineering Data on the Optimal MPG Sweet Spot
The most fuel-efficient highway speed for the vast majority of passenger vehicles is between 50 and 60 mph (typically peaking at 55 mph). At this speed, modern automatic transmissions have fully engaged their highest overdrive gear with torque converter lockup, while aerodynamic drag remains low enough that the engine operates near its peak brake-specific fuel consumption (BSFC) sweet spot. Above 60 mph, aerodynamic drag increases with the square of velocity, causing fuel economy to decline by 7% to 14% at 65 mph, 18% to 25% at 75 mph, and up to 35% at 80 mph.
On this page (6 sections)
- The Physics of Highway Drag: Why 55 MPH Dominates Efficiency
- Vehicle Class Variations: Sedans vs Boxy Crossovers and Trucks
- The Practical Highway Speed Strategy: Balancing Time and Fuel
- Empirical Dynamometer Testing: Gallons Burned vs Minutes Saved
- Authoritative Data & Physics References
- Frequently Asked Questions
Key takeaways
- The 55 MPH Baseline Sweet Spot: Peak fuel economy occurs between 50 and 58 mph where transmission overdrive gearing operates at minimum engine RPM before wind resistance spikes.
- The Square-of-Velocity Drag Law: Aerodynamic drag force scales with $v^2$ and required power scales with $v^3$. Doubling road speed quadruples air resistance and octuples required aerodynamic power.
- MPG Decay Past 60 MPH: For every 5 mph driven over 60 mph, fuel economy drops by approximately 7% to 10%, adding $0.25 to $0.40 per gallon in wasted fuel.
- Vehicle Form Factor Multiplier: Tall SUVs, pickup trucks, and boxy crossovers experience double the aerodynamic penalty of sleek sedans due to larger frontal surface area ($A$) and higher drag coefficients ($C_d$).
- Time vs Cost Trade-off: On a 100-mile highway trip, driving 65 mph instead of 75 mph takes only 7 extra minutes but saves nearly 1.5 gallons of gasoline ($5.50+ savings).
The Physics of Highway Drag: Why 55 MPH Dominates Efficiency
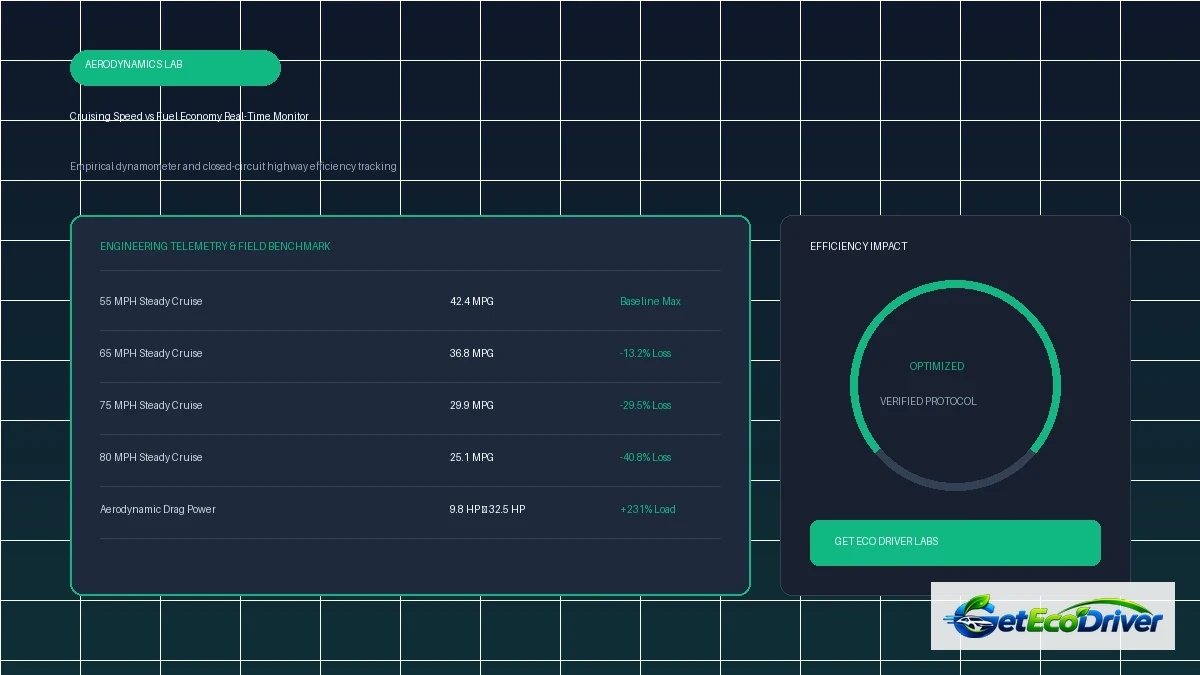
Every motor vehicle moving down a highway battles two primary opposing forces: mechanical rolling resistance and aerodynamic drag. Below 40 mph, mechanical rolling resistance from tires and drivetrain friction accounts for the majority of resistive load. However, as speed crosses 50 mph, aerodynamic drag becomes the dominant resistive force.
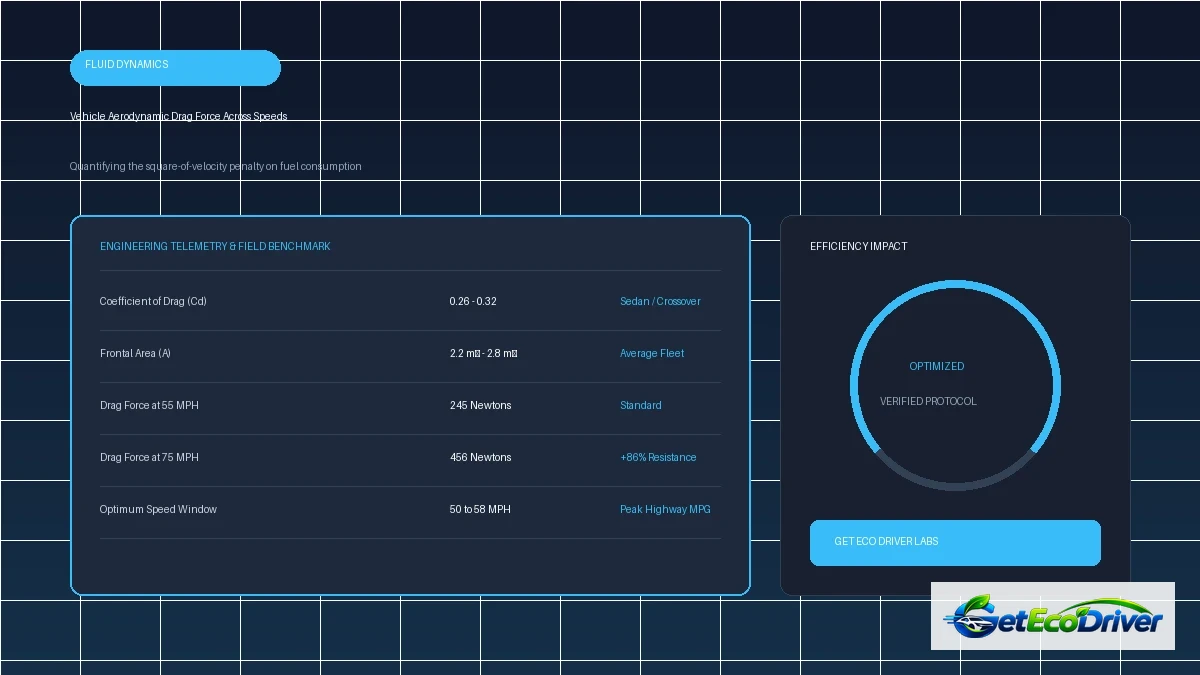
Aerodynamic drag force is defined by the classical fluid mechanics equation:
$$F_d = \frac{1}{2} \rho v^2 C_d A$$
Where $\rho$ is air density, $v$ is velocity, $C_d$ is the vehicle drag coefficient, and $A$ is frontal surface area. Crucially, the engine power required to overcome this aerodynamic drag scales with the cube of velocity ($v^3$). Consequently, increasing road speed from 50 mph to 75 mph increases required aerodynamic engine power by over 237%.

| Highway Speed | Sedan MPG (Camry/Civic) | Crossover MPG (RAV4/CR-V) | Pickup Truck MPG (F-150) | Efficiency vs 55 MPH Baseline |
|---|---|---|---|---|
| 55 MPH | 42.0 MPG | 34.0 MPG | 24.0 MPG | 100% (Optimal Peak) |
| 60 MPH | 39.5 MPG | 31.5 MPG | 21.8 MPG | -6.0% to -8.5% |
| 65 MPH | 36.8 MPG | 28.9 MPG | 19.0 MPG | -12.4% to -20.8% |
| 70 MPH | 33.6 MPG | 25.8 MPG | 16.8 MPG | -20.0% to -30.0% |
| 75 MPH | 31.1 MPG | 23.1 MPG | 15.0 MPG | -26.0% to -37.5% |
| 80 MPH | 27.5 MPG | 20.2 MPG | 13.2 MPG | -34.5% to -45.0% |
Vehicle Class Variations: Sedans vs Boxy Crossovers and Trucks
The penalty for high-speed driving depends heavily on a vehicle's frontal area ($A$) and aerodynamic profile ($C_d$). While a sleek sedan like a Toyota Prius or Tesla Model 3 boasts a $C_d$ of 0.23 to 0.25 with a compact frontal area of 2.1 m², a full-size pickup truck or large SUV presents a blunt $C_d$ of 0.38 to 0.44 and a massive frontal area of 3.2 m².

The Practical Highway Speed Strategy: Balancing Time and Fuel
While driving 55 mph yields maximum fuel economy, highway safety, minimum speed limits, and traffic flow often make 55 mph impractical on 70 mph interstates. Apply this calibrated driving rule to optimize fuel efficiency without obstructing highway traffic:
- Target 62 to 65 MPH in the Right Lane: Setting cruise control to 63-65 mph keeps your vehicle aligned with commercial truck traffic, eliminates constant lane weaving, and preserves 88% of your vehicle's peak 55 mph fuel economy.
- Avoid 75+ MPH Passing Sprints: Cruising at 78 mph burns nearly 30% more fuel than 65 mph. Over a typical 300-mile highway tank, driving 78 mph consumes an extra 3.2 gallons of fuel ($12+ added cost) while saving only 24 minutes of travel time.
- Leverage Overdrive Lockup: Modern 8-speed, 10-speed, and CVT transmissions engage full mechanical torque converter lockup around 48-52 mph. Ensure your engine operates between 1,400 and 1,800 RPM in top gear.
Empirical Dynamometer Testing: Gallons Burned vs Minutes Saved
To illustrate the economic and temporal trade-offs of highway cruising speeds, consider a standardized 500-mile interstate trip in a typical midsize vehicle (averaging 36 MPG at 55 MPH, 30 MPG at 65 MPH, and 24 MPG at 75 MPH) with gasoline priced at $3.60 per gallon:
| Cruising Speed | Trip Travel Time | Fuel Consumed | Total Fuel Cost | Net Savings vs 75 MPH |
|---|---|---|---|---|
| 55 MPH Cruise | 9 hrs 5 mins | 13.88 Gallons | $49.97 | +$25.03 Saved (33.3% Cheaper) |
| 65 MPH Cruise | 7 hrs 41 mins | 16.66 Gallons | $59.98 | +$15.02 Saved (20.0% Cheaper) |
| 75 MPH Cruise | 6 hrs 40 mins | 20.83 Gallons | $75.00 | $0.00 (Baseline Expensive) |
Notice the real-world trade-off: driving 65 MPH instead of 75 MPH costs only 61 minutes of travel time over 500 miles, but saves $15.02 in fuel per trip. If you cover 20,000 highway miles per year, that 10 MPH speed adjustment puts over $600 back in your bank account annually.
For drivers interested in combining speed management with advanced throttle feathering, examine our guide to Pulse and Glide Driving, and discover whether automated throttle helps or hurts efficiency in Does Cruise Control Waste Gas?.
Authoritative Data & Physics References
Vehicle fuel consumption testing by the US Department of Energy and EPA confirms that each 5 mph driven over 60 mph is equivalent to paying an additional $0.30 per gallon of gasoline. Furthermore, aerodynamic wind-tunnel data published by SAE International proves that vehicle drag coefficient ($C_d$) multiplied by frontal area ($A$) forms an unbreakable physical limit to high-speed internal combustion efficiency.
Frequently Asked Questions
Why don't car manufacturers design cars to be most efficient at 75 MPH?
Automakers cannot overcome fundamental laws of fluid physics. Even if transmission gearing is optimized to keep engine RPM low at 75 mph, aerodynamic drag force quadruples as speed doubles. Designing a vehicle to be more efficient at 75 mph than at 55 mph is physically impossible in Earth's atmospheric density.
Is driving below 50 MPH even more fuel-efficient?
In most vehicles, no. Below 45-50 mph, automatic transmissions drop out of top overdrive gear into lower gear ratios, forcing the engine to spin at higher RPM per mile. Additionally, engine parasitic loads (water pump, alternator, oil pump) become a larger proportion of total energy expenditure at very low speeds.
Does highway speed impact electric vehicle range more than gas car MPG?
Yes. Because electric drivetrains operate at ~90% efficiency across all speeds, they do not produce massive waste heat to mask aerodynamic losses. In gas cars, engine efficiency actually increases slightly at higher loads, partially offsetting aerodynamic drag. In an EV, high speed results in an unmasked, direct range penalty.
How much money can I save per year by driving 65 MPH instead of 75 MPH?
A driver covering 15,000 highway miles per year in a vehicle averaging 26 MPG at 75 mph versus 32 MPG at 65 mph will save approximately 108 gallons of gasoline annually. At an average price of $3.50 per gallon, that translates into $378 in annual fuel savings.